It is not surprising that many nonprofit board members do not fully understand financial statements—despite the fact that understanding those statements is very important to good governance.
In my consulting career with non-profits I have found that so many executives and board member have no clue about financial statements and not being able to read and understand financial statements can and often do lead to poor decisions in accessing if the organization’s missions and goals are being met, and in understanding the fiscal position of the organization.
Finance committees and board members, especially those who are in decision-making positions, need to have a clear understanding of the financial reports to be able to recognize potential detrimental problems that will concern funding sources and the ongoing ability of the organization to perform services.
Many organizations today use executive summaries and dashboards to help explain the organization’s financial picture more effectively. These can also be particularly useful tools for a non-financial person. With an executive summary, you are explaining the financial statements in words, whereas a dashboard provides a visual explanation of the financial statements with pictures and graphs.
While the concept behind dashboards and executive summaries is not new, an increasingly popular approach is to include key financial ratios or key performance indicators (KPIs).
KPIs will not only help board members and management understand where the organization is, but will also provide information that will help an organization achieve a desired goal. These indicators should be agreed to in advance and should be used to monitor progress toward achieving those goals.
A common item for a dashboard may be to show a graph depicting trend lines for the amount of cash an organization typically has each month. But what if you expanded this to show the ratio of cash to total expenses?
The example below shows an expense ratio comparing total expenses to total income for a given period of time. Expense ratios can cover all income and expenses for a period, or they can cover expenses and income pegged to specific projects, departments or business units. A monthly expense ratio can reveal trends and cyclical patterns emerging throughout a fiscal or calendar year, providing useful insight for making monthly or annual budgeting decisions and cash projections.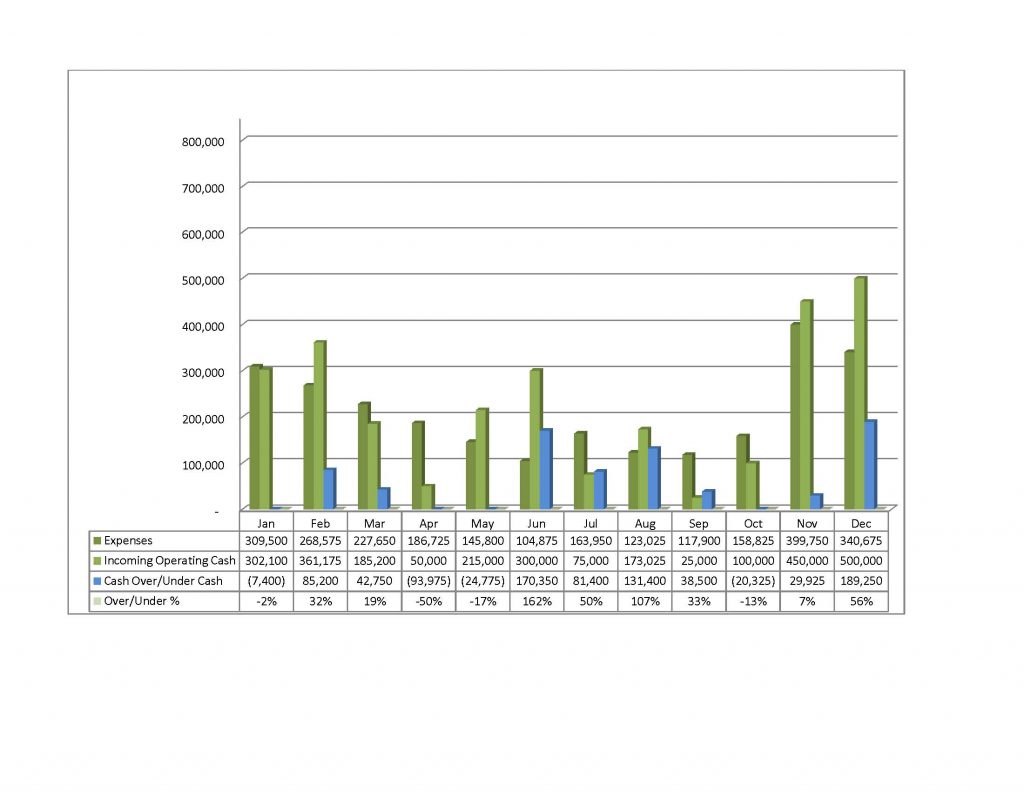
This will not only help management to understand how it is able to cover expenses but can also help it to set goals as to what it might want that ratio to be. Do you want to have 30 days or maybe 60 days of cash on hand? Another option would be to incorporate a graph comparing the organization’s ratio to that of industry standards so the organization understands how it compares to its peers.
Just as every organization uses different types of graphs in its dashboard, the KPIs you use will vary widely as well. KPIs used for a foundation may differ greatly from those used by a trade association. A foundation may want to measure average dollars per donor, whereas a trade association may want to measure retention rates for its members. The key is to ensure KPIs reflect the organization’s goals and are meaningful and quantifiable.
Some common reporting performance ratios include the following:
- Average $ per Donor = Total Donations / Number of Donors
- Collection Rate = Total Payments Received / Gross Charges
- Collection Time = Accounts Receivables x 30 / Net Charges
- Program Efficiency Ratio = Program Services / Total Expenses
- Operating Reliance Ratio = Unrestricted Program Revenue / Total Expenses
- Fundraising Efficiency Ratio = Total Contributions / Fundraising Expense
- Cash Flow Liquidity = Cash + Marketable Securities + Cash Flow from Operations / Total Current Liabilities
- Unrestricted Net Asset Ratio = Unrestricted Net Assets / Annual Expenses
When establishing your KPIs, ensure they are:
- meaningful to the organization
- based on the organization’s strategic plan
- when possible comparable to industry standards/benchmarks
- used by the organization to set goals
- consistent format from year to year
KPIs can also be used as an employee incentive. By monitoring this information on a regular basis, staff may be motivated to be pro-active and correct any red flags before they become major concerns.
Bottom line is, the picture you portray should not only include financial information that comes directly from the financial statements, but also key performance information that will help guide the organization to meet its goals and strategic plan.
Resource for Fiscal Compliance
You will find this book to be invaluable when setting up and maintaining your systems for non-profit finance, compliance and reporting and organizational status reports to your Board of Directors and other interested parties. In addition to performing deliverables, as specified in your program plan, timely and effectively, you should not have to worry about dihttp://mlethadaniels.net/wp-admin/edit.php?post_type=pagescontinued funding due to non-compliance.